
August 2026 Home Values: What the Latest National Data Shows
Every month, Realtor.com publishes a snapshot of where U.S. home prices, inventory, and days-on-market actually stand, based on active listings, not asking-price guesses. August's report shows a market that's cooling, but not panicking: prices are down slightly, price cuts are up, and inventory is growing in every region of the country. Here's what the numbers say, and what they mean depending on which side of a sale you're on.
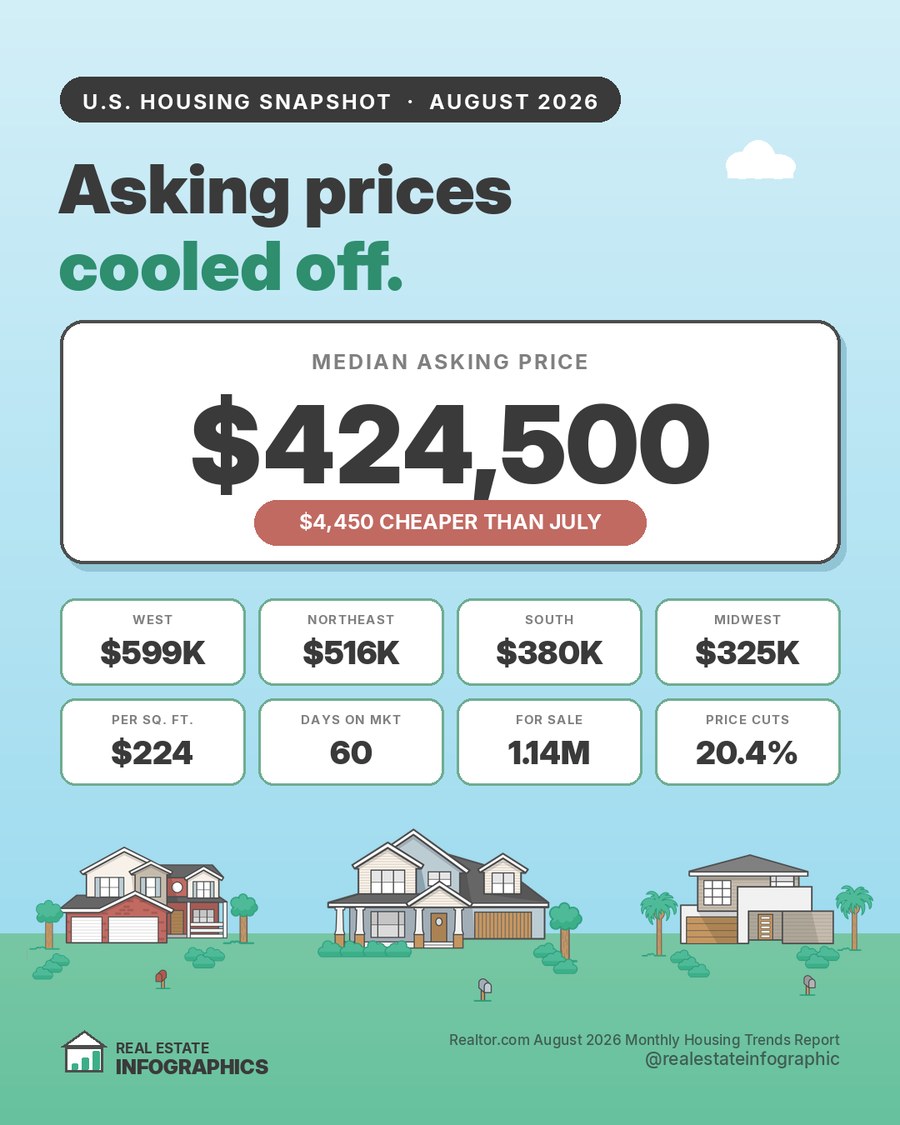
The national snapshot
The median list price per square foot, which adjusts for the size mix of homes on the market, came in at $224, down 1.1% from July. August marked the 10th straight month of year-over-year price declines nationally, though the pace of the decline has slowed to roughly half of what it was in July.
How it breaks down by region
Inventory grew in all four regions, but not evenly. The Midwest (+10.5%) and Northeast (+9.1%) saw the strongest annual growth in active listings, while the West (+3.2%) and South (+1.1%) grew more modestly. That's a notable shift for the Northeast and Midwest specifically, both of which have had comparatively tight inventory for the past few years.
At the metro level, the growth was even sharper in specific markets: Minneapolis (+32.9%), Buffalo (+29.8%), and Seattle (+27.3%) posted the largest year-over-year inventory gains among the 50 largest U.S. metros, while 36 of those 50 metros saw inventory grow at all.
Why prices are cooling, but not falling off a cliff
Realtor.com's economists frame August as a market entering a seasonal cool-down rather than one showing signs of real distress. Pending sales fell year-over-year in August for the first time since last November, and contract signings dropped 3.7% compared to a year ago, both signs that buyer demand softened as mortgage rates ticked back up relative to where they were earlier in the year.
What's kept this from turning into a repeat of last year's rockier late summer is seller behavior. Delistings, homes pulled off the market unsold, were down 12.6% from a year ago in August, with no unusual spike in either July or August. Sellers are adjusting price instead of pulling their homes entirely, which is generally a healthier sign for a market than a wave of withdrawals.
If you're thinking about selling
One in five active listings nationwide now has a price reduction, and in the West and South that share is closer to one in four. If your home has been sitting for a while without much interest, a price cut isn't a sign you did something wrong, it's increasingly just what the current market looks like. Homes are also taking a few days longer to sell than they were in July, though not longer than they were selling a year ago.
Where you're located matters more than the national number. A seller in the Midwest, where prices are flat year-over-year and price cuts are the least common of any region, is in a meaningfully different position than a seller in the West, where prices are down over 2% and nearly a quarter of listings have already cut their price. A local read on your specific market is worth more right now than any national average.
If you're thinking about buying
More inventory is good news if you're on the buying side. Active listings are up in every region, and in fast-growing metros like Minneapolis, Buffalo, and Seattle, buyers have meaningfully more to choose from than they did a year ago. Combined with a rising share of price-reduced listings, buyers in most markets have more room to negotiate than they did earlier in the cycle.
The offsetting factor is financing cost. Realtor.com's economists noted that the year-over-year rate advantage buyers had earlier this year has largely disappeared, mortgage rates in August were running roughly 10 basis points above year-ago levels, compared to more than 30 basis points below a year ago as recently as June. More homes to choose from doesn't necessarily mean a cheaper monthly payment.
Frequently asked questions
What was the median home price in August 2026?
$424,500 nationally, according to Realtor.com's August 2026 Monthly Housing Trends Report. That's down 1.0% from July and down 1.3% from August 2025, marking the 10th consecutive month of year-over-year price declines.
Are home prices going down in 2026?
Nationally, yes, on a year-over-year basis, though the pace has been slowing. August's 1.3% annual decline was roughly half the rate of July's 2.4% drop. Regionally it varies: Midwest prices were essentially flat year-over-year, while Northeast prices fell the most, down 3.6%.
How many homes had price cuts in August 2026?
20.4% of active listings nationwide had a price reduction, up 0.4 percentage points from July and even with August 2025. Price cuts were most common in the West (22.0%) and South (21.4%), and least common in the Northeast (14.1%).
How long are homes staying on the market?
A median of 60 days nationally in August 2026, three days longer than in July, but unchanged from a year earlier. That makes it the second consecutive month where homes sold as fast or faster than the same month a year ago.
Is housing inventory increasing?
Yes. Active listings were up 3.6% year-over-year nationally in August 2026, the fastest annual growth rate so far this year, with gains in every region: the Midwest (+10.5%) and Northeast (+9.1%) led, followed by the West (+3.2%) and South (+1.1%).
Curious what your home is actually worth?
Get a free home value report reviewed by a local real estate professional, no obligation.
Get My Free Home ValueSources, current as of September 2026 (reporting on August 2026 data): Realtor.com August 2026 Monthly Housing Trends Report (via PR Newswire)